Charts showing statistics of natural gas and electricity usage Click Here.
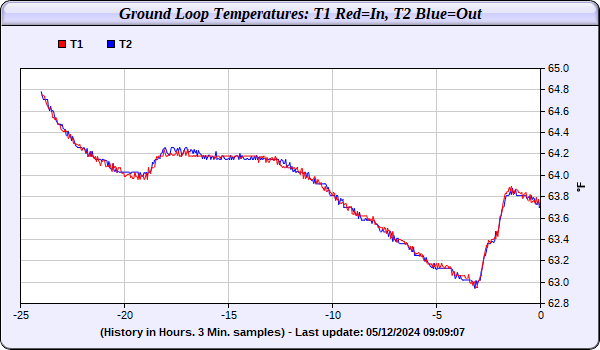
The first chart shows the last 24 hours temperature of the ground loop.
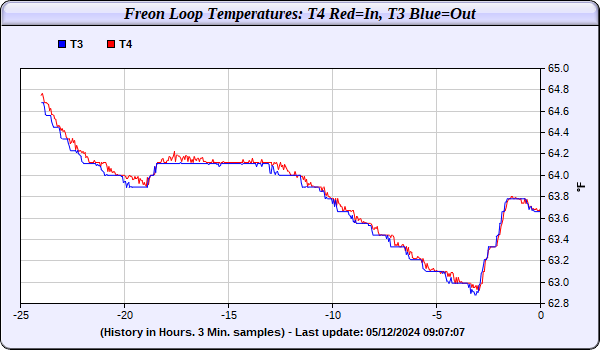
The second chart shows the last 24 hours temperature of the freon loop from the Heat Pump to the Air Handler.
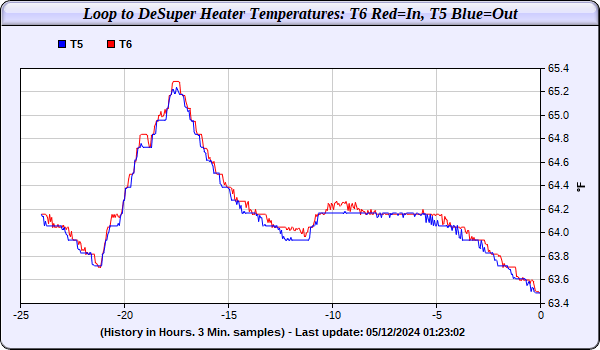
The third chart shows the last 24 hours temperature of the freon loop to the Desuper Heater (Red). The Desuper Heater heats water in the Holding Tank which then feeds the natural gas Hot Water Heater. The return to the Heat Pump line is displayed in Blue.
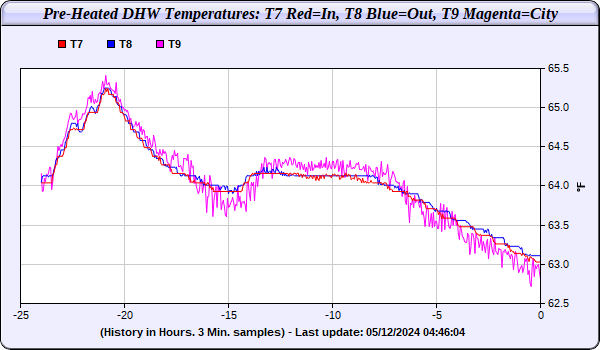
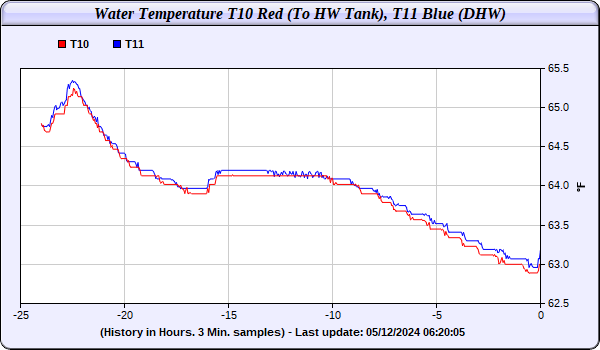
The fourth chart shows the last 24 hours temperature of water flowing from the Desuper Heater to the Holding tank (Red), the temperature of the water from the Holding Tank (Blue) to the Desuper Heater, and the temperature of the water incoming from the City (Green).
The fifth chart shows the last 24 hours temperature of water from the Holding Tank (Red) and from the Hot Water Heater (Blue).
The sixth chart shows the last 24 hours outside air temperature (Red), Attic temperature (Black), Crawl Space temperature (Blue), and the Thermostat temperature (Green).
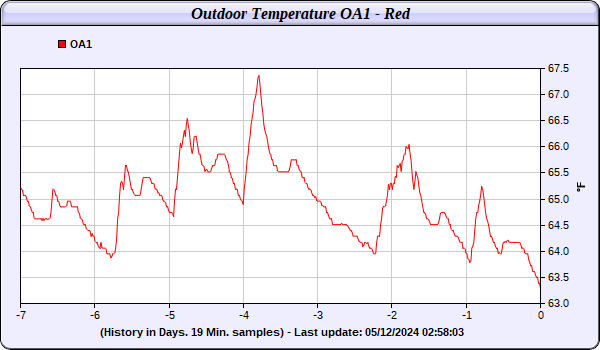
The seventh chart shows the last 7 dayss Outdoor temperature (Red).
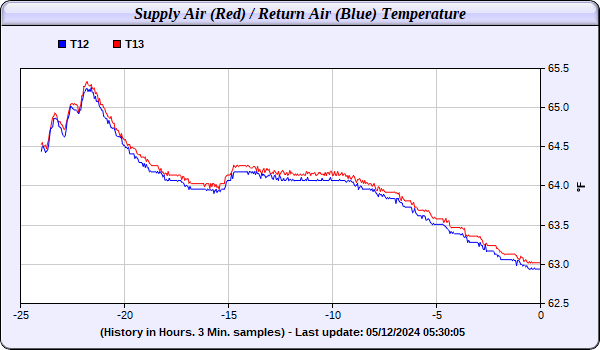
The eigth and last chart shows the last 24 hours Supply Air temperature (Blue) and the Return Air temperature (Red).
